By: Tod Trabocco
ITE, Head of Product & Strategy
Disclaimer
This document is for informational purposes only and is not intended as an offer or solicitation for the purchase of sale of a security or other financial product, which may only be made at the time a qualified offeree receives a Confidential Private Placement Memorandum. This document contains information provided by several third-party sources not affiliated with ITE Management L.P. (“ITE”) have not been independently verified by ITE, and ITE makes no representation regarding its accuracy or completeness, or that it represents the most up-to-date information from such party. Information in this document is current as of the date hereof unless otherwise indicated.
Not for distribution or reproduction without the consent of ITE.
Storage is an important mechanism for regulating rail car supply in North America.
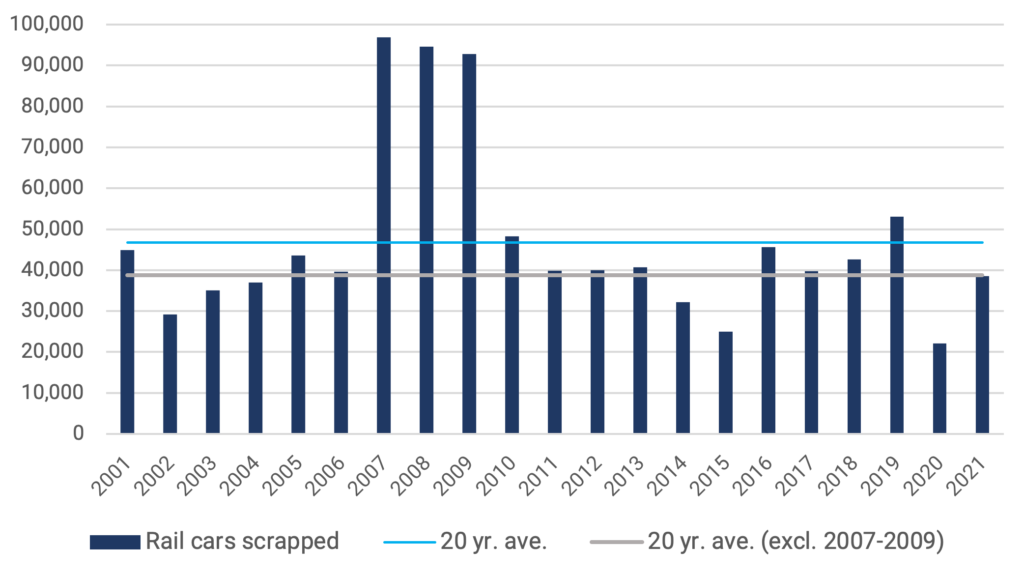
ANNUAL RAIL CAR SCRAPPING LEVELS (2001-2021)
Source: FTR, ITE
Operators store rail cars when temporary overcapacity arises and remove them from storage as demand for commodities and products recovers. In our white paper, NORTH AMERICAN RAIL CAR SUPPLY AND DEMAND, we explore how rail car supply in North America is governed by regulation and end-user demand. Cars older than 50 years are barred from use on Class I rail roads by regulation, permanently removing 40,000 to 45,000 cars (of approximately 1.6 million in North America) from supply each year, based on data collected from various sources, including FTR Transportation Intelligence (FTR). At the same time, manufacturers usually build new rail cars only when lessees and lessors order them, adding new supply only when the end users demonstrate clear demand driven by their own operating needs. This powerful combination of consistent, regular removal of old rail cars and disciplined, demand-driven building of new rail cars balances supply and demand in North America, supports car values and protects against long term overcapacity.
Bouts of temporary oversupply can occur briefly before vanishing as supply and demand rapidly rebalance.
The last two years offer an excellent case study in the nimbleness of North American rail car supply. As Covid clobbered the global economy, operators quickly stored their rail cars, temporarily removing excess capacity. Then, as steel prices climbed steeply over the same period, they started scrapping cars, thus permanently removing supply. As demand recovered, stored rail cars rolled back into the operating fleet to meet rising demand for transportation as Covid’s economic fallout mitigated.
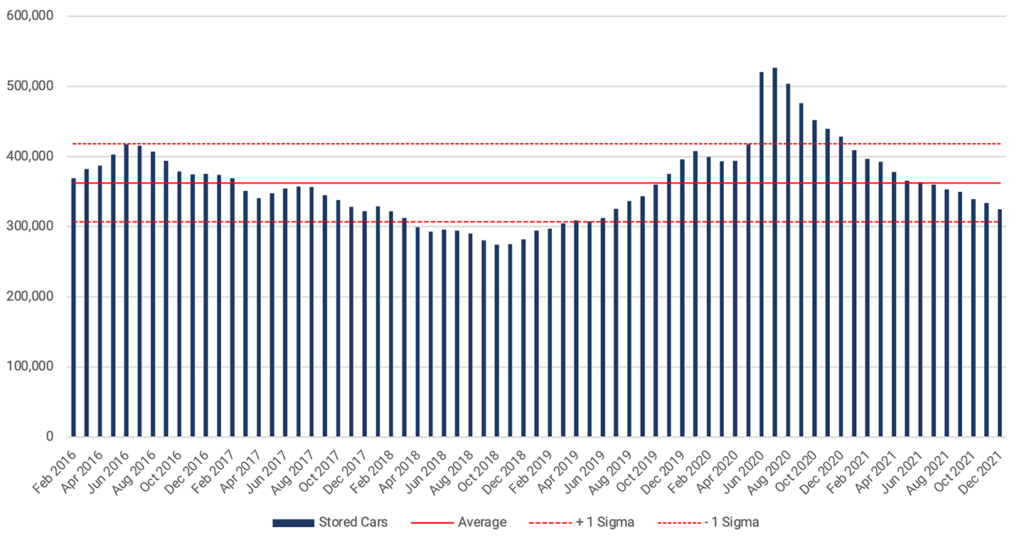
According to data from the American Association of Railroads (AAR) an average of approximately 360,000 rail cars, or an estimated 20% to 25% of the North American fleet is “stored” annually (defined as a car that has not moved in 60 days or has moved empty since carrying its last load). This is not bad news for rail car lessors, as long-term leases typically require lessees to make lease payments regardless of rail car usage. As the US economy slammed to a halt in 2020, shipments of various products and commodities slowed somewhat.
MONTHLY RAIL CAR STORAGE LEVELS (2016-2021)
Source: AAR, ITE
Facing temporary reduced demand, shippers stored parts of their fleets and by June 2020 almost a third of the North American fleet was in storage (ITE estimates).
These storage numbers are more than three standard deviations off the four-and-half year mean from January 2016 to July 2020. In other words, ITE estimates that it took little more than four months following Covid’s emergence for approximately 8% of the North American rail car fleet to be placed in storage. In a capital-intensive industry, the ability to remove temporarily almost 10% of supply in less than half a year is very beneficial to operators and investors. Furthermore, ITE estimates that eight months after peaking, rail car storage levels returned to pre-Covid levels. In one short year from April 2020 to March 2021, rail car supply hit a five-year peak in response to an unprecedented economic crisis and then reverted to pre-crisis levels.
However, levels did not remain at pre-crisis levels for very long and moved steadily to almost one standard deviation below the five-year mean. The reason for this is likely the combination of rising demand linked to economic recover as well as the impact of steel prices on scrappage and new supply.
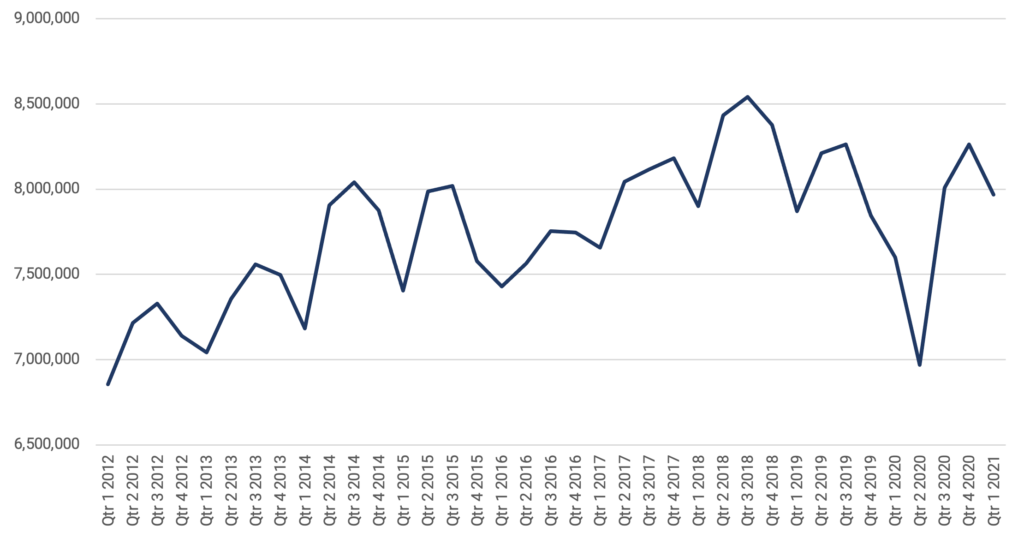
NA CAR LOADINGS (2012-2021)
Source: AAR, ITE
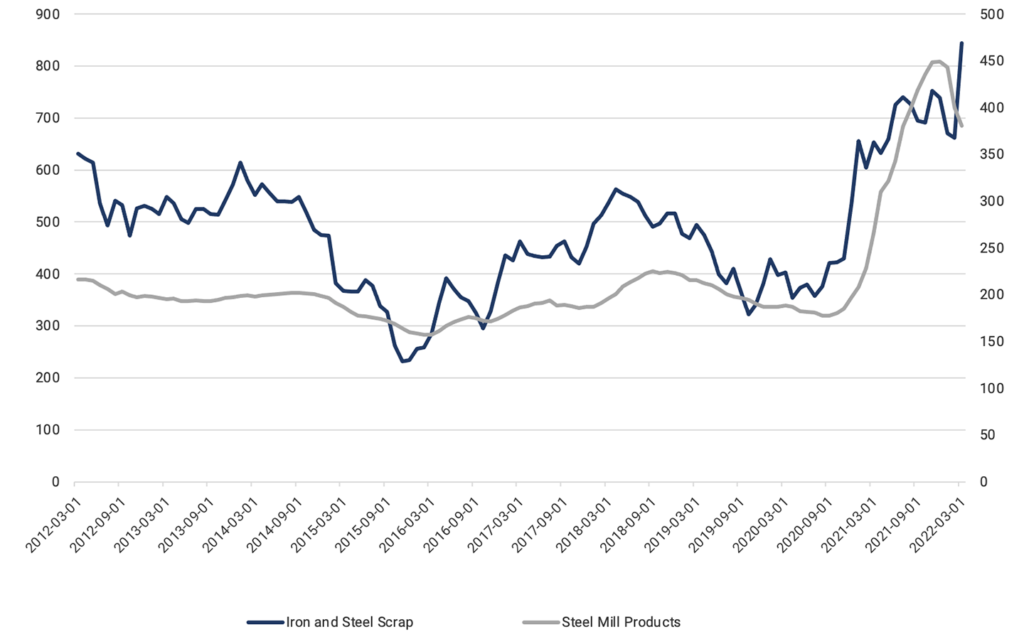
While steel prices are not the key driver of rail car values, steel is the single largest material cost in rail car production, making price movement impossible to ignore.
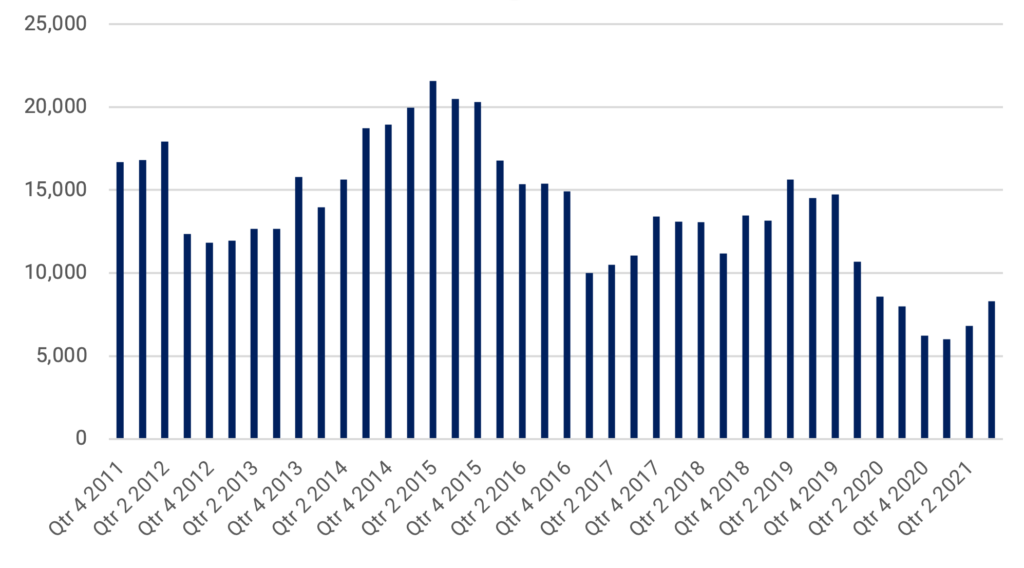
From 2020 to 2022 steel prices doubled, triggering both a similar estimated doubling in scrappage from 2020 to 2021 and a decline in new car demand. Lessors responded by delaying the ordering of new supply because they did not want to hold potentially historically expensive rail cars. As a result, if we look back 40 quarters (10 years) from Q4 2011 to Q3 2021 and identify the 10 quarters with the lowest delivery levels, we find that 7 of them occurred in 2020 and 2021, according to FTR.
STEEL PRICE INDICES (2012-2022) – 1986 = BASE YEAR
Source: FRED, ITE
NEW DELIVERIES (Q4 2011 – Q3 2021)
Source: FTR, ITE
Conclusion
In sum, storage levels play an important role in moderating temporary supply and operators can make supply adjustments through storage very quickly. In the past two years, we have seen storage used to reduce supply in response to an economic downturn, then quickly add it all back, and more, as demand returned and other areas of supply contracted. Of course, stored rail cars are not an inexhaustible source of supply and we expect continued downward storage trends below the long term mean eventually to stimulate the introduction of new, permanent supply.


